Financial Summary
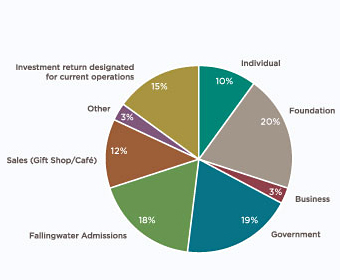
| OPERATING SUPPORT | ||
| Contributions/Grants & Memberships | Millions | % |
| Individual | $1.6 | 10% |
| Foundation | 3.3 | 20% |
| Business | 0.5 | 3% |
| Government | 3.2 | 19% |
| 8.6 | 52% | |
| Earned Income | ||
| Fallingwater Admissions | 3.1 | 18% |
| Sales (Gift Shop/Café) | 2.1 | 12% |
| Other | 0.5 | 3% |
| 5.7 | 33% | |
| Internal Income | ||
| Income on Investments | 2.5 | 15% |
| $16.8 | 100% |
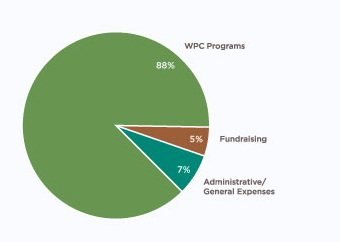
| OPERATING EXPENSES | ||
| Programs | Millions | % |
| Conservation | $5.1 | 30% |
| Fallingwater | 5.2 | 31% |
| Community Gardens & Greenspaces |
3.0 | 18% |
| Constituent Programs and Outreach |
0.8 | 5% |
| Depreciation (principally programs) |
0.7 | 4% |
| 14.8 | 88% | |
| Program Support | ||
| Fundraising | 0.9 | 5% |
| Administrative/General | 1.1 | 7% |
| $16.8 | 100% |